- News
- Reviews
- Bikes
- Accessories
- Accessories - misc
- Computer mounts
- Bags
- Bar ends
- Bike bags & cases
- Bottle cages
- Bottles
- Cameras
- Car racks
- Child seats
- Computers
- Glasses
- GPS units
- Helmets
- Lights - front
- Lights - rear
- Lights - sets
- Locks
- Mirrors
- Mudguards
- Racks
- Pumps & CO2 inflators
- Puncture kits
- Reflectives
- Smart watches
- Stands and racks
- Trailers
- Clothing
- Components
- Bar tape & grips
- Bottom brackets
- Brake & gear cables
- Brake & STI levers
- Brake pads & spares
- Brakes
- Cassettes & freewheels
- Chains
- Chainsets & chainrings
- Derailleurs - front
- Derailleurs - rear
- Forks
- Gear levers & shifters
- Groupsets
- Handlebars & extensions
- Headsets
- Hubs
- Inner tubes
- Pedals
- Quick releases & skewers
- Saddles
- Seatposts
- Stems
- Wheels
- Tyres
- Health, fitness and nutrition
- Tools and workshop
- Miscellaneous
- Buyers Guides
- Features
- Forum
- Recommends
- Podcast
feature
 Aeropod - 2.jpg
Using the Velocomp AeroPod: does the device that promises drag measurement on the fly deliver?
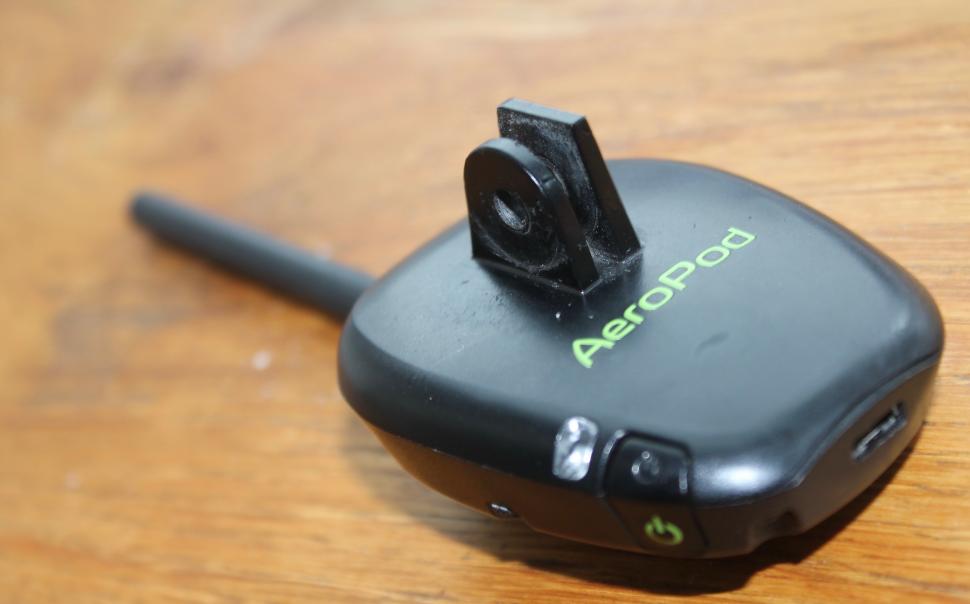
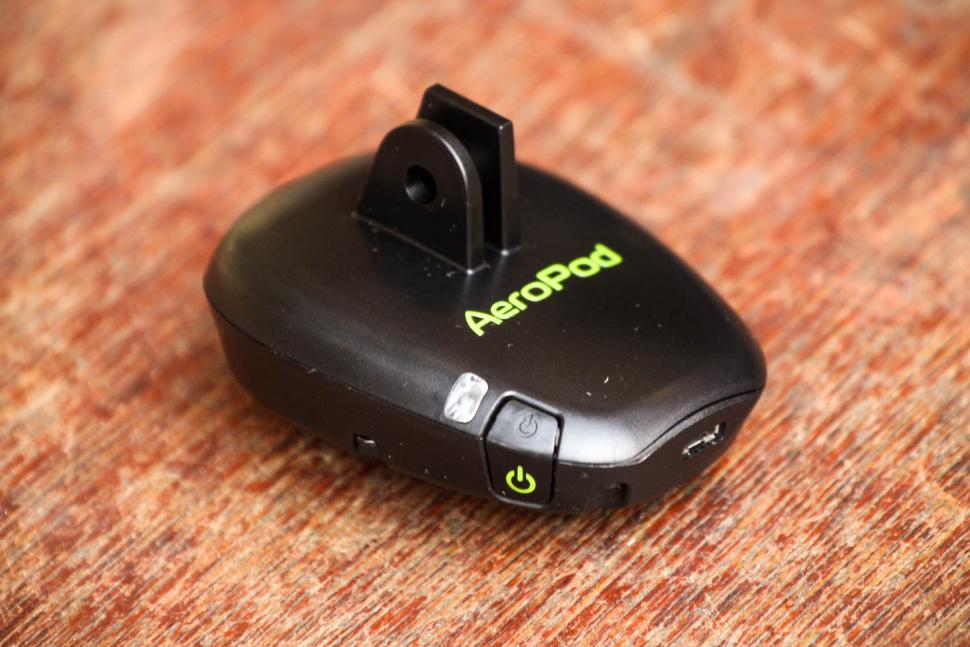
The Velocomp AeroPod is a little device that, along with its associated software and a direct force power meter, can help you achieve aerodynamic efficiency on the bike, although I'll warn you right away that you need a detail-focused mindset to get the most out of it.
One of the features of AeroPod is that it's possible for you to measure drag in real time as you ride (Notio also claims its device can calculate drag in real time), but we've found that if you're interested in comparing the relative aerodynamic merits of different bike/equipment/position setups, you need to be prepared to do a little post-ride spadework!
Before we get into all that, I need to give you a bit of background info.
The theory
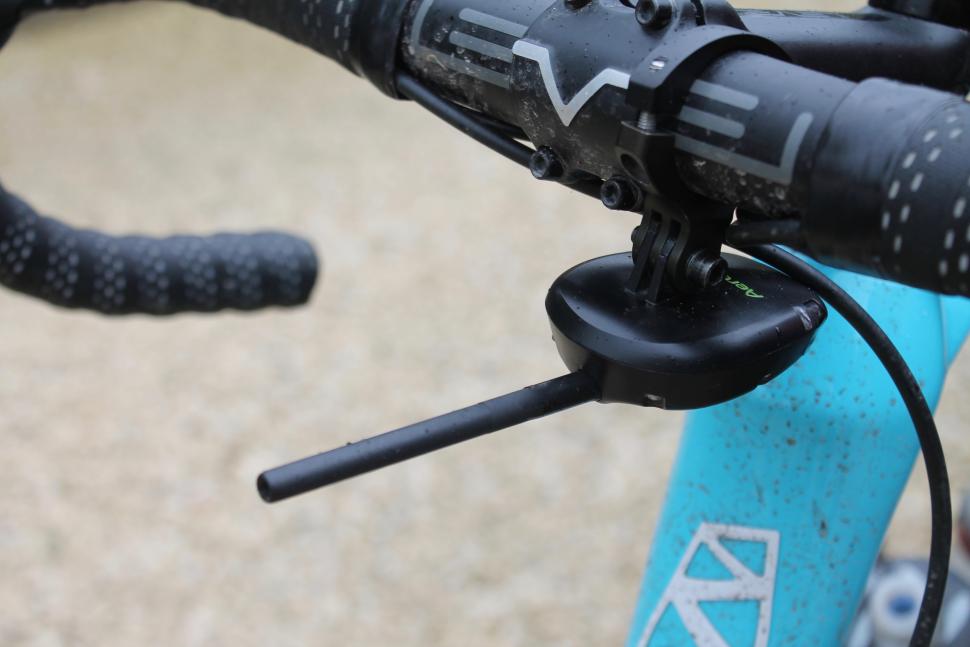
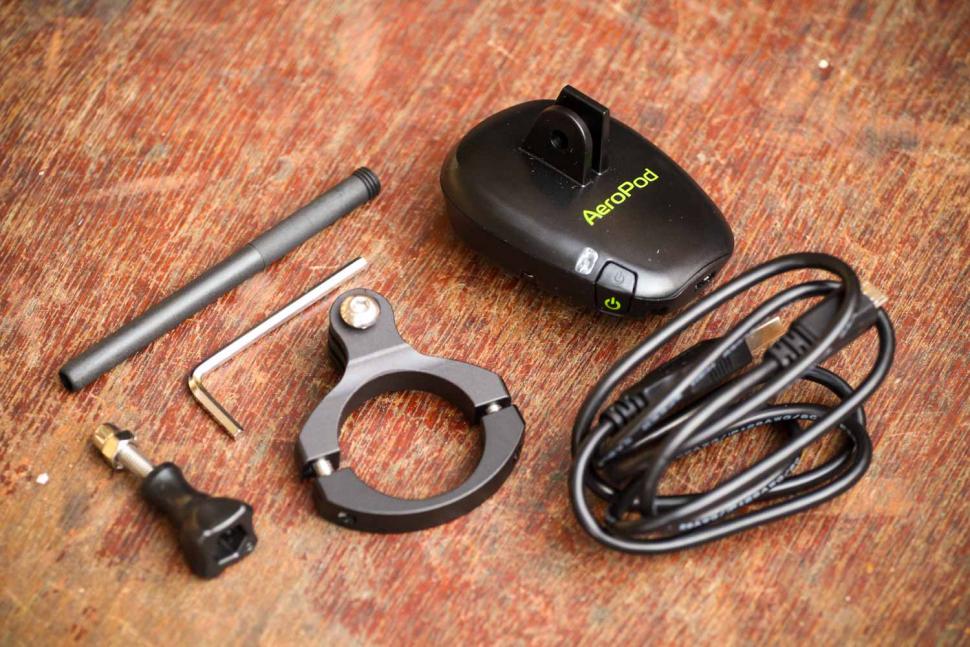
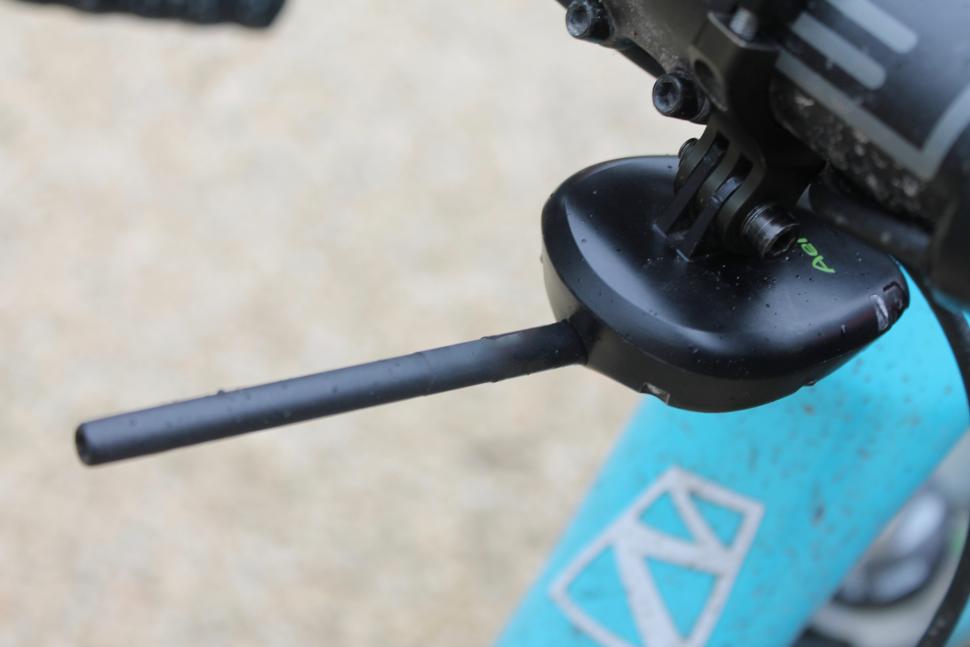
AeroPod bolts to the underside of your handlebar, a slim pitot tube (which measures flow speed) pointing forward.
AeroPod works alongside a direct force power meter – something like a PowerTap hub, Garmin Vector pedals or a Shimano Dura-Ace crank-based power meter. If you already own one, great. If you don't, well, you have to factor in the considerable cost. The direct force power meter's applied force measurements are transmitted wirelessly to the AeroPod.
A direct force power meter calculates the power you apply to overcome the opposing forces caused by wind, hills, acceleration and friction.
The AeroPod, on the other hand, comes at things from a totally different angle, looking at the opposing forces rather than the applied force.
Newton's third law of motion says that for every action (or force) there is an equal and opposite reaction. This means that all of the opposing forces must equal the applied force.
• Wind speed is measured via the pitot tube and wind sensor
• Hills and acceleration are based on the AeroPod's accelerometer
• Friction is determined from the coefficient of rolling resistance.
Coefficient of rolling resistance isn't measured as you ride, it is a figure derived from tyre type, tyre inflation, and road type. You input these when you first set up your AeroPod. It assumes the coefficient of rolling resistance is a constant value that doesn't change during the bike ride (so changing from smooth tarmac to bumpy gravel mid-ride would throw it off, for example).
"AeroPod measures and 'knows' all of the factors needed to make opposing forces equal applied forces, except drag," says Velocomp.
"To convert AeroPod’s wind speed measurements into wind force measurements, a drag value must be used in the conversion equation. When the correct value of drag is used, the total opposing forces measured by AeroPod equal the applied force of the direct force power meter."
In short, AeroPod compares direct force power meter applied force readings to Aeropod's opposing force sensor readings and calculates the real-time drag value required to make the two equal.
That's the theory. Set up your Garmin with a bespoke screen and run the AeroPod alongside a direct force power meter (not the easiest thing in the world first time around, but you'll get there) and you can have a real-time drag reading on your computer as you ride.
Is it a credible reading, though? We were sceptical. It just sounds a bit, you know, hopeful. If any of the AeroPod's opposing force readings (or the coefficient of rolling resistance constant) are wrong, the drag calculation will surely be incorrect too.
Plus, the drag reading on the screen jumps about, and although you can easily tell that the figures you get when you're down on the drops are different from those you get when you're sitting bolt upright in the saddle, it's far more difficult to identify more subtle changes on the fly.
We decided to perform a series of tests...
Our first aero testing
road.cc's Dave Atkinson just happened to have recently gone to the wind tunnel at the Boardman Performance Centre in Evesham to optimise his setup on a Boardman SLR 9.6 Disc, and we have drag data relating to several different ride positions he tried out in the tunnel.
This means we already know how the drag of several different positions compares for this rider, on this bike, wearing this clothing (assuming the wind tunnel data is correct, of course).
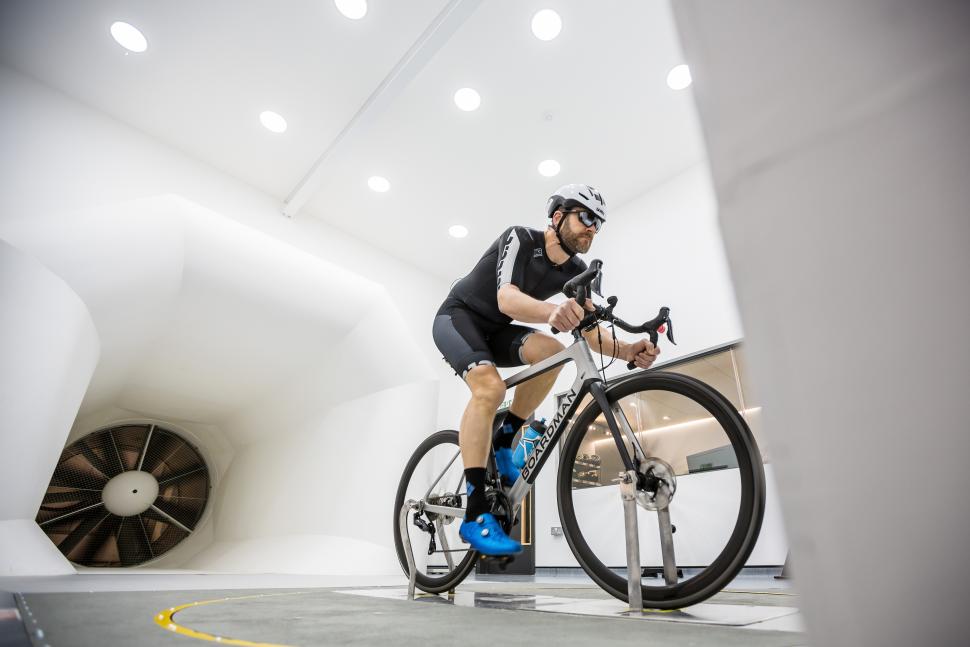
"That's very useful," we thought. "Let's see whether the AeroPod gives similar results out on the road."
Find out all about a day at the Boardman Performance Centre
So we took Dave along to the 1.5km long Odd Down Cycle Circuit in Bath to do some testing.
First, we calibrated Dave's Garmin Vector pedals before pairing them to a Garmin 520 bike computer.
Then we attach a speed sensor to the front wheel, set it to the correct tyre size, and paired the speed sensor to the AeroPod.
Next we paired the AeroPod to the Garmin 520 bike computer.
Finally, Dave went on 10-minute calibration ride. You only have to do most of this once, by the way. On subsequent rides, calibration is done during the first 5mins and then you're good to go.
Okay, so we were ready to start testing. We were looking for drag figures for five different riding positions:
Position A: standard position with hands on the hoods.
Position B: aggressive 'breakaway' position with hands on the hoods, forearms flat and body low.
Position C: hands on the drops.
Position D: virtual tribar position – no tribars fitted, but in a position that mimics their use.
Position E: optimised position with hands on the drops and body low.
Details of the positions aren't really important, it's just how the AeroPod's results compared with the wind tunnel's results that interested us.
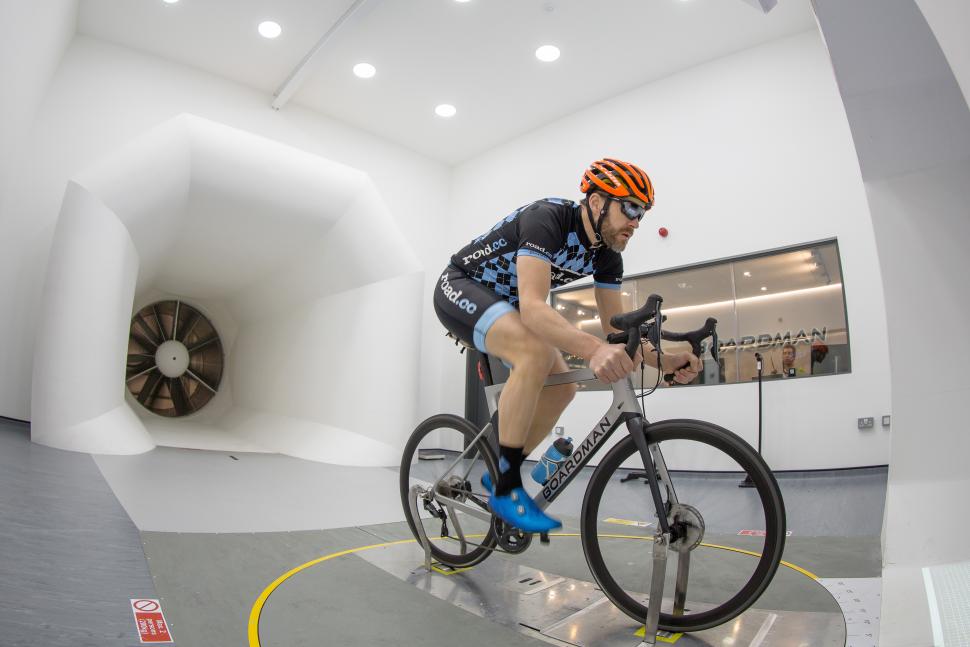
We wanted a test time in each position of 6-10 minutes, so Dave rode three laps in the first position at a constant power output, then hit the lap timer button on the Garmin. He immediately changed position and rode three more laps in the next position, and so on.
Although we were just looking at ride positions, this protocol would be the same for comparing the drag of different equipment. You could stop after the first lap and switch helmets, for example, or put on shoe covers. The important thing is that you make just one change each time so that you can isolate the impact of any particular variable.
What did the data show?
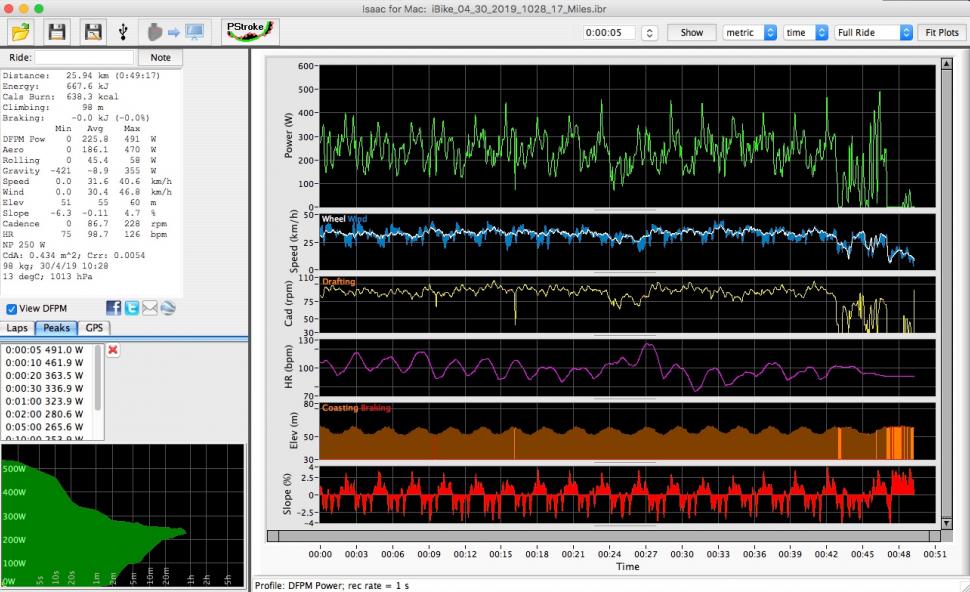
As mentioned up top, AeroPod works alongside the Isaac software that you install on your computer. Isaac is an integral part of the system. PC and Mac versions are available.
Although the real-time drag reading on a Garmin does allow you to test new setups out on the road, uploading data to Isaac for full analysis is the way forward.
Isaac has a vast number of different features (the instruction manual runs to 80 pages) but I'll touch on just one here: CdA (coefficient of aerodynamic drag) analysis.
Getting the hang of it isn't particularly easy. You have to learn a few techniques and it definitely helps if you're into numbers!
One of the things Isaac can do is compare the power measurements of your direct force power meter and AeroPod, and allow you to remove any discrepancy and the resultant effect that would have on the CdA figures.
I won't go too deeply into that here because a new screen has just been developed that makes things a whole lot easier. To cut a long story short, here's the data we got for Dave:
Position A: CdA 0.463
Position B: CdA 0.387
Position C: CdA 0.403
Position D: CdA 0.346
Position E: CdA 0.384
Here are the five positions ranked from best to worst in terms of aerodynamic efficiency, according to the AeroPod and Isaac software:
1. Position D
2. Position E
3. Position B
4. Position C
5. Position A
The figures from the wind tunnel gave this ranking:
1. Position D
2. Position B
3. Position E
4. Position C
5. Position A
In other words, the AeroPod/Isaac ranking is the same as the wind tunnel ranking except that positions E and B swap places. According to the AeroPod's figures, the CdAs of those two positions were very similar to one another (0.384 versus 0.387).
The findings were interesting enough that we wanted to delve deeper.
Further aero testing
I decided to go back to the Odd Down circuit to do some testing of my own to compare two different setups:
1. Wearing a Kask Valegro helmet and Poc glasses
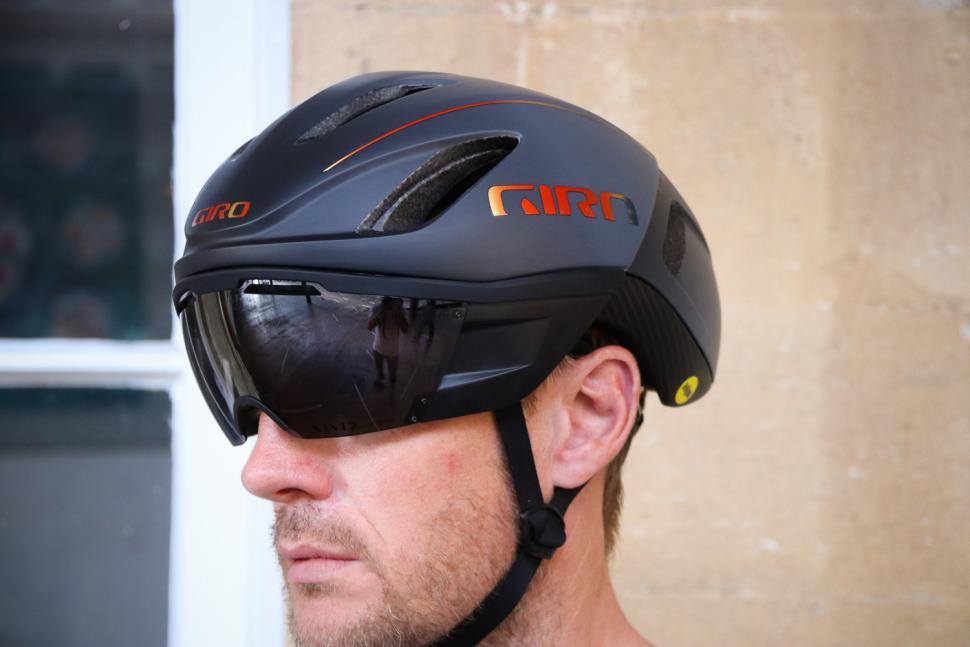
2. Wearing a Giro Vanquish MIPS helmet with integrated eye shield
The Kask Valegro is a lightweight, highly vented helmet (read our review here) whereas Giro describes the Vanquish MIPS as "the pinnacle of aerodynamic road cycling helmets".
The bike and all other equipment, including clothing, would remain the same throughout testing, of course, and so would the riding position.
I wanted to know if AeroPod could give me consistent advice as to the more aerodynamically efficient choice. That seemed like a reasonable test.
I used a similar test protocol to Dave. After calibrating everything, I rode around the circuit three times at a consistent power output while using the Kask helmet and Poc glasses, and then hit the lap button on my Garmin. I continued riding another three times around the circuit and hit the lap button a second time. Then I rode around three more times and hit the lap button a third time.
I stopped, swapped the Kask helmet and Poc glasses for the Giro helmet and repeated the procedure.
Here are the results:
Kask Valegro helmet/Poc glasses
Lap 1: CdA 0.335
Lap 2: CdA 0.368
Lap 3: CdA 0.482
Giro Vanquish helmet
Lap 4: CdA 0.357
Lap 5: CdA 0.353
Lap 6: CdA 0.353
The results from the three Giro Vanquish laps are very consistent, but the results from the Kask helmet/Poc glasses combo varied widely. Why? I don't know, is the honest answer. Although the average of the CdA figures for the Giro Vanquish helmet was lower than the average for the Kask helmet/Poc glasses, you wouldn't have much confidence that it was the more efficient option from these results.
I wasn't happy with those figures and decided to go again on another day, but this time I wore the Giro Vanquish helmet for laps 1-3 (just to keep the AeroPod on its toes!). Here are the results:
Giro Vanquish helmet
Lap 1: CdA 0.326
Lap 2: CdA 0.332
Lap 3: CdA 0.333
Kask Valegro helmet/Poc glasses
Lap 4: CdA 0.342
Lap 5: CdA 0.343
Lap 6: CdA 0.338
As you can see, these blocks are much more consistent and all three of the Giro Vanquish results are lower than any of the Kask helmet/Poc glasses results. The figures are very close – an average of 0.330 versus an average of 0.341 – but the clear advice from the AeroPod is that the Giro Vanquish helmet is the more aerodynamically efficient option.
Now, you might say, you could have guessed that. Maybe, but during Dave's wind tunnel testing he found that adding an aero cover to a helmet he was using resulted in greater drag – the exact opposite of what you'd expect. If you're guessing, there's always the chance that you'll guess wrong.
We did wonder whether perhaps the AeroPod got lucky with its consistency on this occasion so we ran the test again with similar results. This time the CdA figures we got from the Isaac software were slightly different from those shown above (so we wouldn't compare figures from one test session with figures from a different test session), but we got a similar level of consistency and the same overall recommendation.
Oh, one other thing to mention is that you couldn't get this information simply from lap times. Of course, if you put out exactly the same power in exactly the same conditions, a more aerodynamically efficient setup will result in lower lap times. The trouble is, in the real world you never get the same conditions from one minute to the next (you might in an indoor velodrome), and holding precisely the same power output for lap after lap is damn near impossible. You can get a consistent average power easily enough, but how you've applied your power will never be exactly the same from one lap to the next.
Summary
The real-time drag values that AeroPod gave on the Garmin screen as we rode along didn't do a whole lot for us, but things got a lot clearer when we downloaded the data and ran it through the Isaac software. We were able to get credible results that allowed us to compare the aerodynamic efficiency of different setups, and that could well be valuable if you race or time trial.
We would caution, though, that you have to be persistent. In our experience, you can't just bolt the AeroPod to the front of your bike and have useful results instantly flashed up before your eyes. It'll take time for you to hone your testing technique and get into the swing of interpreting the results.
AeroPod is priced £499 and is available through www.dhwagencies.com. Get more information at www.velocomp.com
Mat has been in cycling media since 1996, on titles including BikeRadar, Total Bike, Total Mountain Bike, What Mountain Bike and Mountain Biking UK, and he has been editor of 220 Triathlon and Cycling Plus. Mat has been road.cc technical editor for over a decade, testing bikes, fettling the latest kit, and trying out the most up-to-the-minute clothing. We send him off around the world to get all the news from launches and shows too. He has won his category in Ironman UK 70.3 and finished on the podium in both marathons he has run. Mat is a Cambridge graduate who did a post-grad in magazine journalism, and he is a winner of the Cycling Media Award for Specialist Online Writer. Now over 50, he's riding road and gravel bikes most days for fun and fitness rather than training for competitions.
Latest Comments
- chrisonabike 3 min 58 sec ago
A good point - cyclists are somewhere between pedestrians and motorcyclists (a few - electric motorcycles mainly, which are not legal) in terms of...
- David9694 29 min 4 sec ago
Retired policeman from Swanley fined after forgetting to display blue badge at free Bluewater car park...
- cyclisto 1 hour 3 min ago
Not a brand guy in general, but this is a company thinking out of the box, while avoiding being niche expensive. They threw good stuff on the...
- Rendel Harris 1 hour 48 min ago
To paraphrase the Dalai Lama ("One should be kind whenever possible. And it is always possible"), there should only be 20mph limits in towns when...
- Rendel Harris 2 hours 17 min ago
Welcome - probably didn't show as they tagged it "not near miss of the day"?
- David9694 9 hours 37 min ago
Cambridgeshire boy, 13, crashes Audi into garden wall after taking it from home...
- Dogless 11 hours 40 min ago
You're defending bombing hospitals and refugee camps and starving children.
- mattw 14 hours 20 min ago
Used car salesman is a complete attention-seeking plank....
- tubasti 14 hours 37 min ago
I don't know if they're any better, but they's certainly become more boring.
- FionaJJ 15 hours 3 min ago
At risk of being cynical, and stereotyping the police, it's so they don't have to leave the comfort of their panda cars and pursue on foot when...


Add new comment
11 comments
Reading their homepage, it does have more sensors than the article mentioned, including the barometer. Also they recommended not to use a single sided power meter.
£350 sounds like a price at which they might sell a few to people with power meters which cost more than that.
As an alternative, how about the home wind tunnel? Put a massive fan in the kitchen door (blowing out), mount the bike on a turbo on a skateboard, and use kitchen scales to measure the aero drag directly. iPhone Anemometer to get the wind speed, job done.
Interestingly it is being sold on Amazon for £350 much less than the list price of £499
https://www.amazon.co.uk/Velocomp-AeroPod-Performance-Knife-Bikes/dp/B07...
You could club together with a few mates, use it then ebay it if crap.
Very interesting.. I'd like to see some pure TT set-ups tested.. maybe difference between skin suits or TT helmets and or shoe / socks.. would be interesting to see how much 'consistent' aero differences they produced.
CLASS bit of independent testing. Top marks road.cc
I'd give the review 7/10. It reviews a measuring device, but gives no indication of how accurate it is, even though they have data that could estimate that.
Agree with you Freddy56. Definitely a step above the usual subjective stuff "I felt that the tyre rolled well", "I thought that the bikes was quite aerodynamic".
For quantitation of performance, it's almost worth learning German to read Tour magazine (and Bike, the MTB pendant) which tests stuff properly: rolling resistance and puncture resistance of tyres, stiffness/comfort/aerodynamics of frames and wheelsets, wear resistance of chains and chainsets, heat resistance of disc brakes, warmth of clothing, etc. They use their own labs and also the Zedler Institute.
You might argue that this is too much teutonic thoroughness, but their tests directly have lead to the bikes we have today because they cut through the marketing and there is nowhere for bulls**t to hide. The German-speaking countries make up the biggest market for road bikes, especially at the high end, and the brands are desperate to get a good review/ avoid a bad review in Tour, so they design bikes to get good reviews in the tests.
No English version unfortunately, they tried but it did not work out: https://www.tour-magazin.de
Thanks to the magic of Google translate Tour comes up in pretty good English when I click the link. Nothing like clicking through pictures of smiling, tanned riders in the Dolomites to rub in how rubbish the weather has been in the South West for the last however long! No wonder it didn't catch on, far too upbeat for here.
Interesting concept, but for this to work, you'll have to have the consistently smoothest of peddle strokes.
When i used to have a power meter, the power numbers would jump up and down around 25-50 watts, which is why i would switch to a 3 second keep the range of numbers tighter. But that would give a delay between effort and readings. It would be almost impossible to detect a 15 Watt improvement from, say, rolling your shoulders forwards in a time trial tuck, unless you managed to hold that position for a substantial amount of time.
Disclaimer: The article probablyaddresses this, and ive only looked at the pictures, read the headlines.
Why post this before finding out if it is indeed an issue? Of course it handles smoothing data etc.
Now, if you could mount a strain gauge on the front fork you could measure rolling resistance in real time, and take out the road surface variation (as well as testing the stories of this blue inner tube rolls faster than a black one etc)...
The sun is out. I should probably just go for a ride on my bike.
Interesting to see some of the results for precision, but what is the accuracy like? How does it compare to the wind tunnel data in numbers? Ordering A to E in the same way is one thing, but how do the absolute values compare?
I would really like to see a measurement system analysis for this device. The helmet test shows the challenge- the variation within a test of the same conditions can be greater than the variation between the conditions (helmets in this case).
I have a detail-focussed mindset (aka data nerd), but the data would have to be really good to justify £500 on top of a power meter. A pitot tube sensor on its own is £20. A full functioning pitot anemometer is £150. An iPhone turbine anemometer is £45. The iPhone I'm typing this on has a three-axis accelerometer, barometer and thermometer (not mentioned in the article but gets you to air density), data logging, wireless connection to a power meter, a display, and plenty of processing power. It might even be possible to put a reed in the end of a straw, and hook it to the microphone, and link that to the decibel meter. Would it be as good as the £500 device? Probably not, but it would be fun and cheap to try. But then I'm more of a gadget hacking nerd than a time trial nerd.