- News
- Reviews
- Bikes
- Accessories
- Accessories - misc
- Computer mounts
- Bags
- Bar ends
- Bike bags & cases
- Bottle cages
- Bottles
- Cameras
- Car racks
- Child seats
- Computers
- Glasses
- GPS units
- Helmets
- Lights - front
- Lights - rear
- Lights - sets
- Locks
- Mirrors
- Mudguards
- Racks
- Pumps & CO2 inflators
- Puncture kits
- Reflectives
- Smart watches
- Stands and racks
- Trailers
- Clothing
- Components
- Bar tape & grips
- Bottom brackets
- Brake & gear cables
- Brake & STI levers
- Brake pads & spares
- Brakes
- Cassettes & freewheels
- Chains
- Chainsets & chainrings
- Derailleurs - front
- Derailleurs - rear
- Forks
- Gear levers & shifters
- Groupsets
- Handlebars & extensions
- Headsets
- Hubs
- Inner tubes
- Pedals
- Quick releases & skewers
- Saddles
- Seatposts
- Stems
- Wheels
- Tyres
- Health, fitness and nutrition
- Tools and workshop
- Miscellaneous
- Buyers Guides
- Features
- Forum
- Recommends
- Podcast
news
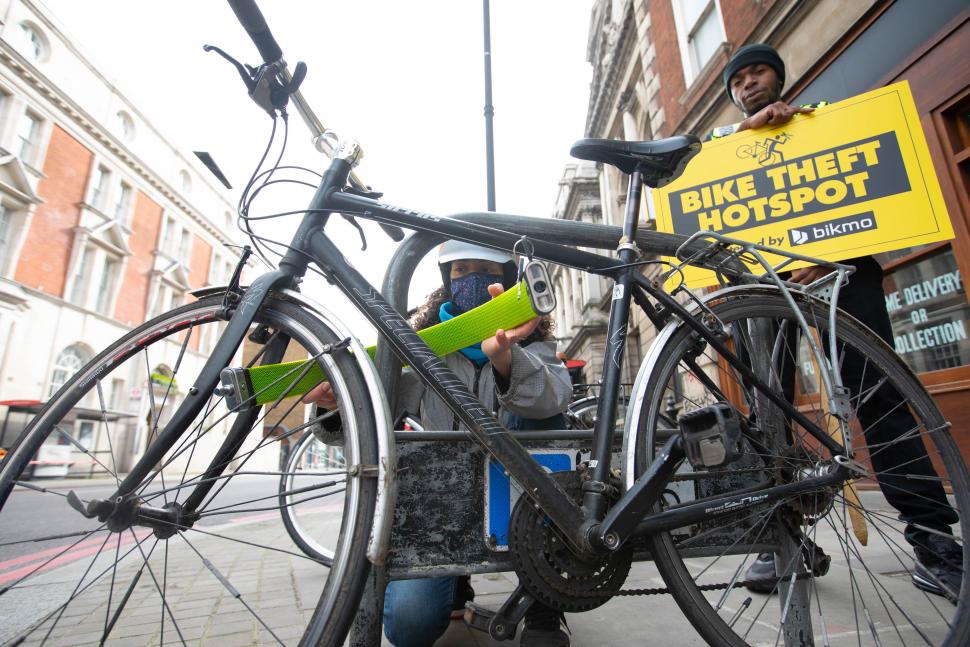
 Cyclist locking bike in Hackney (picture credit Bikmo).JPG
How active are bike thieves in your area? New online bike theft tracker helps you find out
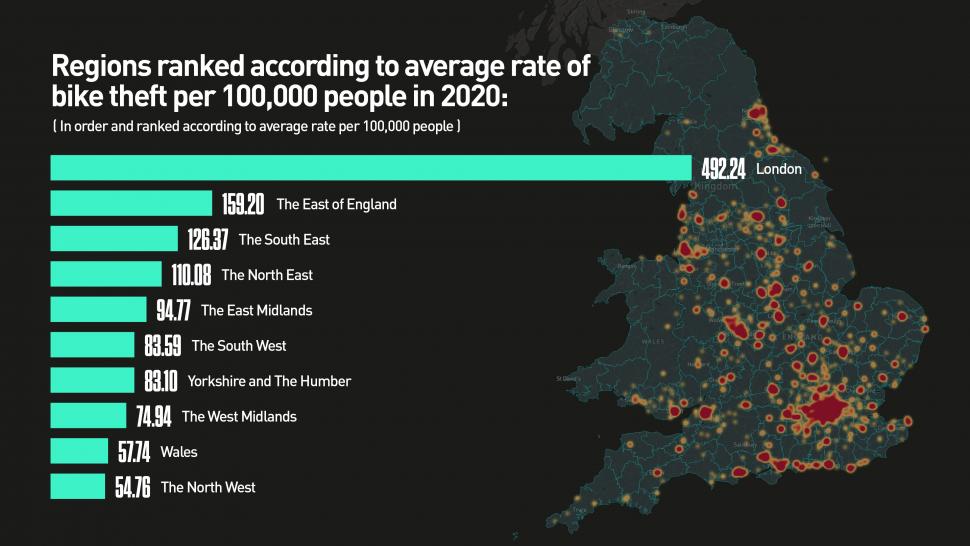
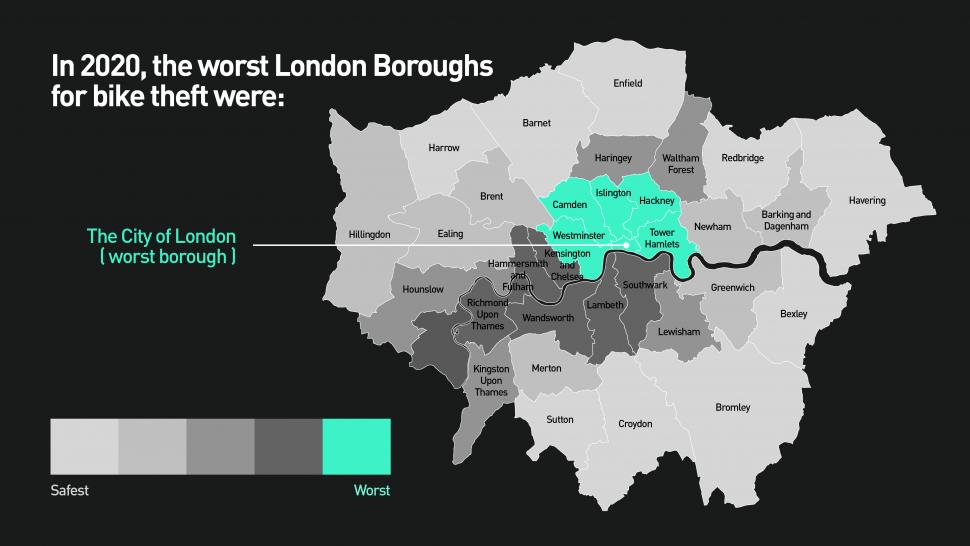
A new interactive heatmap developed by specialist cycle insurer Bikmo and based on crime data from police forces across England and Wales shows that the London Borough of Hackney saw the highest number of reported bike thefts last year – 2,324 in all, a 46 per cent increase from 2019, accounting for 3 per cent of all cases of bicycles reported stolen across the two countries.
The borough bucked the national trend, however, with the 74,573 total reported bike thefts in 2020 down 11 per cent on the previous year – despite unusually widespread coverage in the mainstream press of cycle thefts in the early part of the year perhaps giving the opposite impression, explained by the newsworthiness of bikes being stolen from NHS staff during the first national lockdown.
> Cycle thefts down by 25% during COVID-19 lockdown
Bikmo says that by overlaying crime statistics with population data, which enables areas to be given a rate of reported cycle thefts per 100,000 residents can help people “make more informed choices about where to safely lock their bikes,” with the aim of reducing overall bike theft, which it says “is of increasing concern to new and returning riders during the pandemic.”
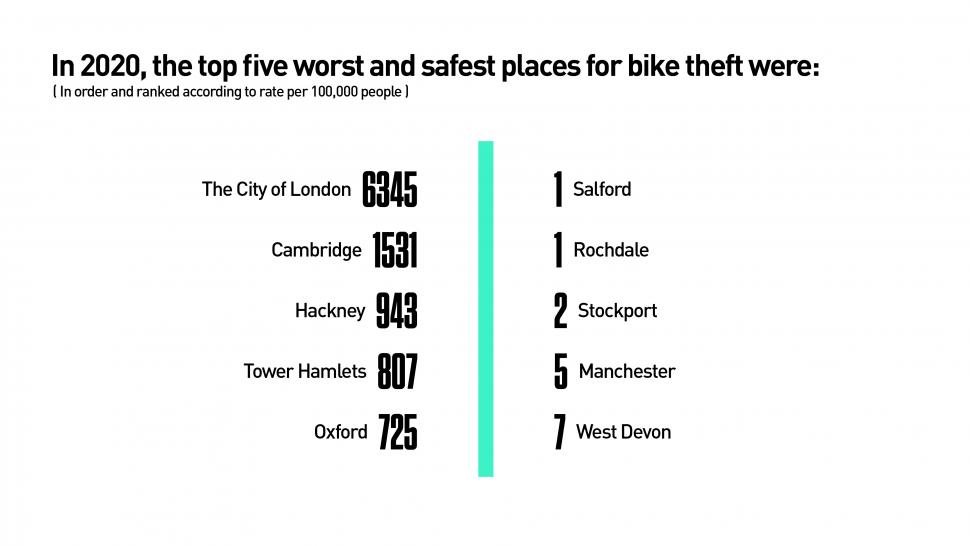
On that measure, the City of London came out top by far, with a rate of 6,345 thefts per 100,000 residents, although given its specific characteristics – a resident population of less than 10,000, but a working population (in non-pandemic times) upwards of half a million people, it is something of an outlier.
Next came the country’s leading city in terms of the percentage of people cycling regularly, Cambridge, with a rate of 1,531 – a fivefold decrease on 2019, possibly explained by the absence of students during lockdown, as well as fewer people commuting from the city’s railway station, a well-known bike theft hotspot.
Also in the top five were Tower Hamlets, with a rate of 807, and Oxford, the city with the second highest levels of cycling in England and Wales, with 725 reported thefts per 100,000 residents.
The four areas with the lowest levels of bike theft per 100,000 population – Salford and Rochdale on one apiece, Stockport on two, and the City of Manchester, on four – all fell within Greater Manchester.
However, Bikmo provided the caveat that with Greater Manchester Police found to have failed to report more than 80,000 crimes in 2020, it is likely that many stolen bikes will not have been recorded.
The next lowest figure was from West Devon, with seven thefts per 100,000 population, followed by another local authority within the same county, Torridge, on nine, and then the Welsh county of Ceredigion, on 11.
Commenting on the launch of the interactive bike theft tracker, Bikmo CEO David George said: “As more and more people begin to realise the many benefits of cycling during the Pandemic, it is only natural that fears around bike theft will rise.
“We are proud to today unveil a brand new public tool, allowing riders across the country to view annual bike theft rates in their local area and identity hotspots where crimes are being reported.
“The new tool will be regularly updated to provide an ongoing resource to members of the public. We hope this will be useful to the fast growing number of riders, and help increase awareness in high-risk areas.”
You can find out more information on Bikmo’s bike theft tracker, as well as its insurance products tailored towards cyclists, here.
Simon joined road.cc as news editor in 2009 and is now the site’s community editor, acting as a link between the team producing the content and our readers. A law and languages graduate, published translator and former retail analyst, he has reported on issues as diverse as cycling-related court cases, anti-doping investigations, the latest developments in the bike industry and the sport’s biggest races. Now back in London full-time after 15 years living in Oxford and Cambridge, he loves cycling along the Thames but misses having his former riding buddy, Elodie the miniature schnauzer, in the basket in front of him.
Latest Comments
- ktache 3 hours 28 min ago
The small frame, the aggressive posture, lots of standover height.
- mctrials23 4 hours 24 min ago
As i've said before, the police should be sued for a lot of money when someone they have knowingly ignored has gone on to commit a serious crime....
- David9694 4 hours 31 min ago
'Bad parking' blocks firefighters multiple times on same emergency call-out...
- David9694 4 hours 35 min ago
Cambridgeshire boy, 13, crashes Audi into garden wall after taking it from home...
- Adam Sutton 5 hours 21 min ago
Good stuff. Now do it on cycleway C9 through Hammersmith to Chiswick.
- mark1a 5 hours 30 min ago
It's technically allowed but it's not known as "London's Orbital Car Park" for nothing.
- Dogless 6 hours 38 min ago
You're defending bombing hospitals and refugee camps and starving children.
- mattw 9 hours 18 min ago
Used car salesman is a complete attention-seeking plank....
- tubasti 9 hours 35 min ago
I don't know if they're any better, but they's certainly become more boring.
- FionaJJ 10 hours 1 min ago
At risk of being cynical, and stereotyping the police, it's so they don't have to leave the comfort of their panda cars and pursue on foot when...


Add new comment
3 comments
The tool can be found here:
http://bike-theft-map.bikmo.com/
Those results show up a pretty obvious problem here - population isn't really a meaningful divisor. If you want to make a useful comparison, it would need to take into account something like bike ownership, or number of bike journeys.
I'm also slightly confused about why the map based on data from England and Wales also includes (part of) Scotland and/or Northern Ireland. Even if there is a technical explanation for this (e.g. the victim was on holiday when their bike got nicked and reported it back home to their local police force) it seems sloppy to include them on the final map when they are clearly incomparable.