- News
- Reviews
- Bikes
- Accessories
- Accessories - misc
- Computer mounts
- Bags
- Bar ends
- Bike bags & cases
- Bottle cages
- Bottles
- Cameras
- Car racks
- Child seats
- Computers
- Glasses
- GPS units
- Helmets
- Lights - front
- Lights - rear
- Lights - sets
- Locks
- Mirrors
- Mudguards
- Racks
- Pumps & CO2 inflators
- Puncture kits
- Reflectives
- Smart watches
- Stands and racks
- Trailers
- Clothing
- Components
- Bar tape & grips
- Bottom brackets
- Brake & gear cables
- Brake & STI levers
- Brake pads & spares
- Brakes
- Cassettes & freewheels
- Chains
- Chainsets & chainrings
- Derailleurs - front
- Derailleurs - rear
- Forks
- Gear levers & shifters
- Groupsets
- Handlebars & extensions
- Headsets
- Hubs
- Inner tubes
- Pedals
- Quick releases & skewers
- Saddles
- Seatposts
- Stems
- Wheels
- Tyres
- Health, fitness and nutrition
- Tools and workshop
- Miscellaneous
- Cross country mountain bikes
- Tubeless valves
- Buyers Guides
- Features
- Forum
- Recommends
- Podcast
feature
 2021 Merida eScultura 400 - riding 2.jpg
How to use Strava to make you fitter
Strava is a handy app for recording your rides, keeping up-to-date with rides your mates have completed, and it’s also an impressive training tool for tracking, measuring and analysing your performance. Strava even has a few of its own exclusive metrics for dialling into your fitness in a unique and useful way.
Some of Strava's fitness-focussed features are not as easy to find, while others are slightly more difficult to get your head around.
> How to make the most of Strava’s exploring features for your next adventure
We spoke to Strava’s Simon Klima, as well as ABCC Accredited Cycling Coach Tom Murray of Mint Cycling to find out which of the more advanced analytical features can be a massive help with training, as well as how to use them.
Simon tells us: “We try to cater for commuters up to Tour de France stage winners so we want to make sure that we’ve got features that work across that really broad church of cyclists.
“We aggregate data and present it in a meaningful way to riders—one that’s motivating, entertaining and shareable with the community.”
Here are the features it is worth being aware of for smashing your fitness targets:
Set some personal goals
Lots of different types of custom goals can be set on Strava to help you stay on track with your fitness or to challenge yourself.
> How to maximise your fitness when you get to 40+
“Setting weekly or annual goals can be a really good way of keeping motivated,” says Simon. A target distance (in kilometres or miles) or a target number of hours can be set on the platform, like a weekly or annual challenge. This is split across the type of activity, so you can have different goals for bike rides and runs.
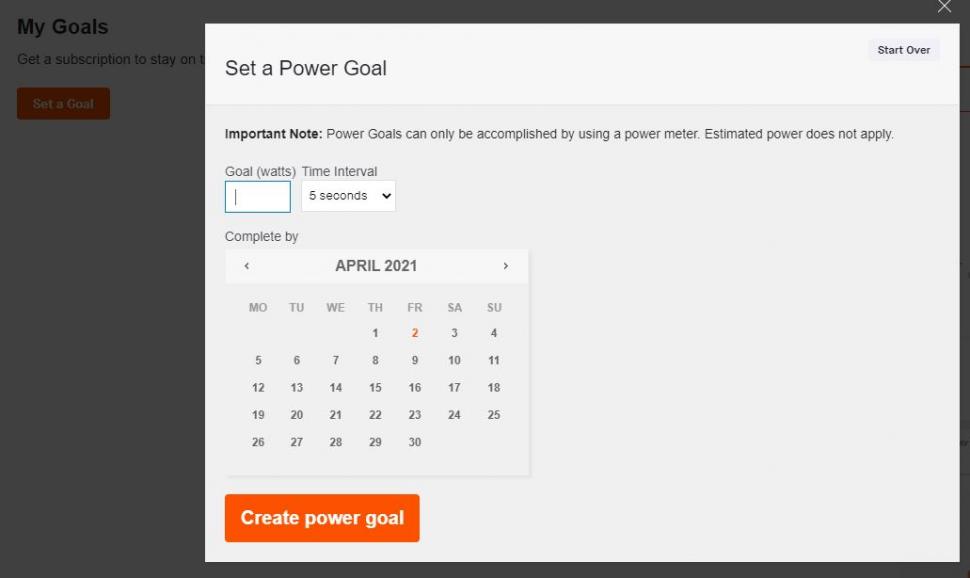
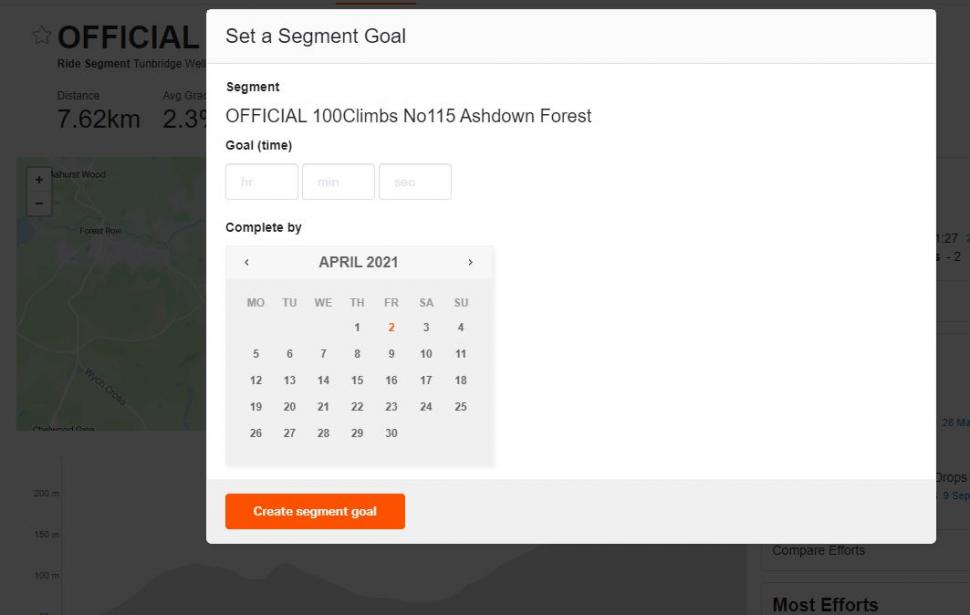
Aside from volume accumulation style goals, more specific targets can be set for improvements, whether that’s hitting higher watts on different length intervals or slashing down your time on specific Strava segments.
Power goals can be set for efforts as short as 5 seconds and up to one hour, and a target date is selected to aim to reach your target.
The segment feature on Strava does not only have to be about clawing yourself higher up the leaderboard, the platform enables you to set goals that are completely personal to you. For each segment, you can set a personal goal time, as well as when you’d like to hit that target by, like the power goal.
Compare your rides with Relative Effort
Relative Effort tracks your heart rate through a workout, and it provides a score to show how hard you’ve worked, based on your maximum heart rate. With each workout, you complete you’ll receive a Relative Effort score (displayed to the right of elevation total in desktop view), as well as a total for the week.
> How training zones can help you get your greatest cycling fitness gains
“It’s a good way of comparing a short, sharp ride and a much longer leisurely ride,” Simon notes.
Balance your Fitness and Freshness
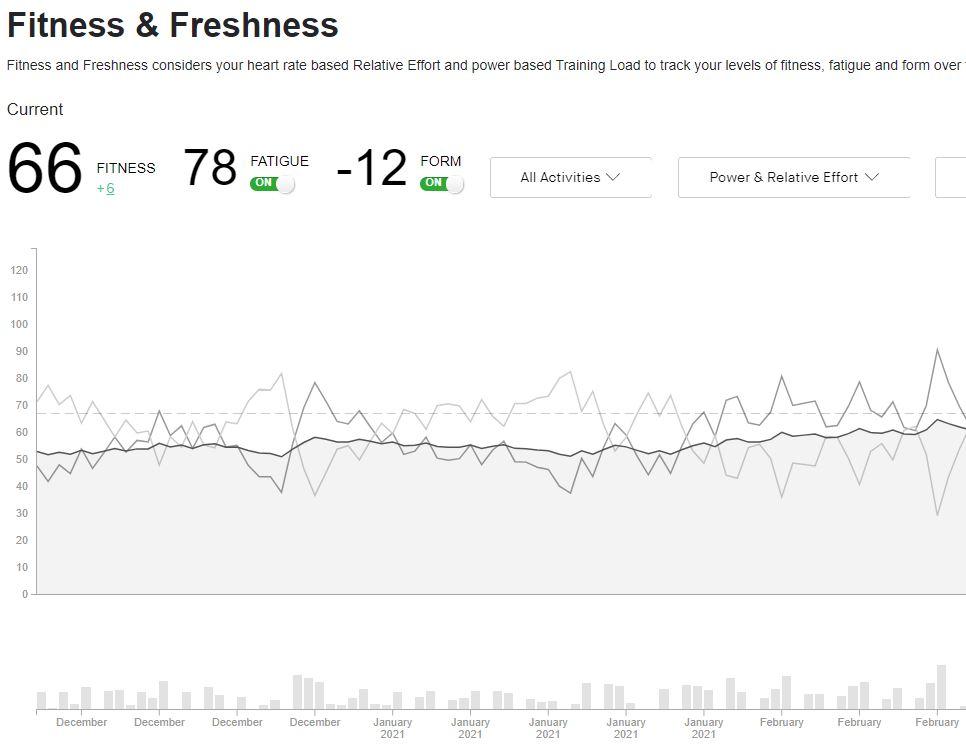
The Fitness and Freshness feature on Strava enables you to track your levels of fitness, fatigue and form over time, and it presents this data in a graph.
“The Fitness score is relative to you, you can’t compare it to anyone else’s—it’s a benchmark of your own fitness,” Simon notes.
“It is a super useful tool for peaking at a certain time of your season and giving structure in how you approach your training,” Tom says.
“Fitness and Freshness tracks the intensity, power, heart rate, distance covered in your activities and turns all of this data into a relative figure called fitness. It then plots this onto a graph, which is individual to each rider.”
“The more you train, the more your fitness figure will rise. But at the same time, because you are training, fatigue is also building, so your freshness (form) is getting worse.
“To have form for an event, you need your fitness score to stay high, but it’s also important for your fatigue number to drop.” This also applies when taking a recovery week between training blocks (with roughly three weeks on, one week off for recovery).
> How to maximise your recovery and build your fitness
“The Fitness and Freshness graph is a really good way of monitoring these numbers and giving you direction to your season. Over time you’ll be able to understand the trends.”
Tom admits it is one of the more complicated features, but if you want to use Strava to closely track and improve your fitness, as well as prepare for events, “it’s the gold dust” he says. Now that’s some praise…
Track your activities using the Training Log
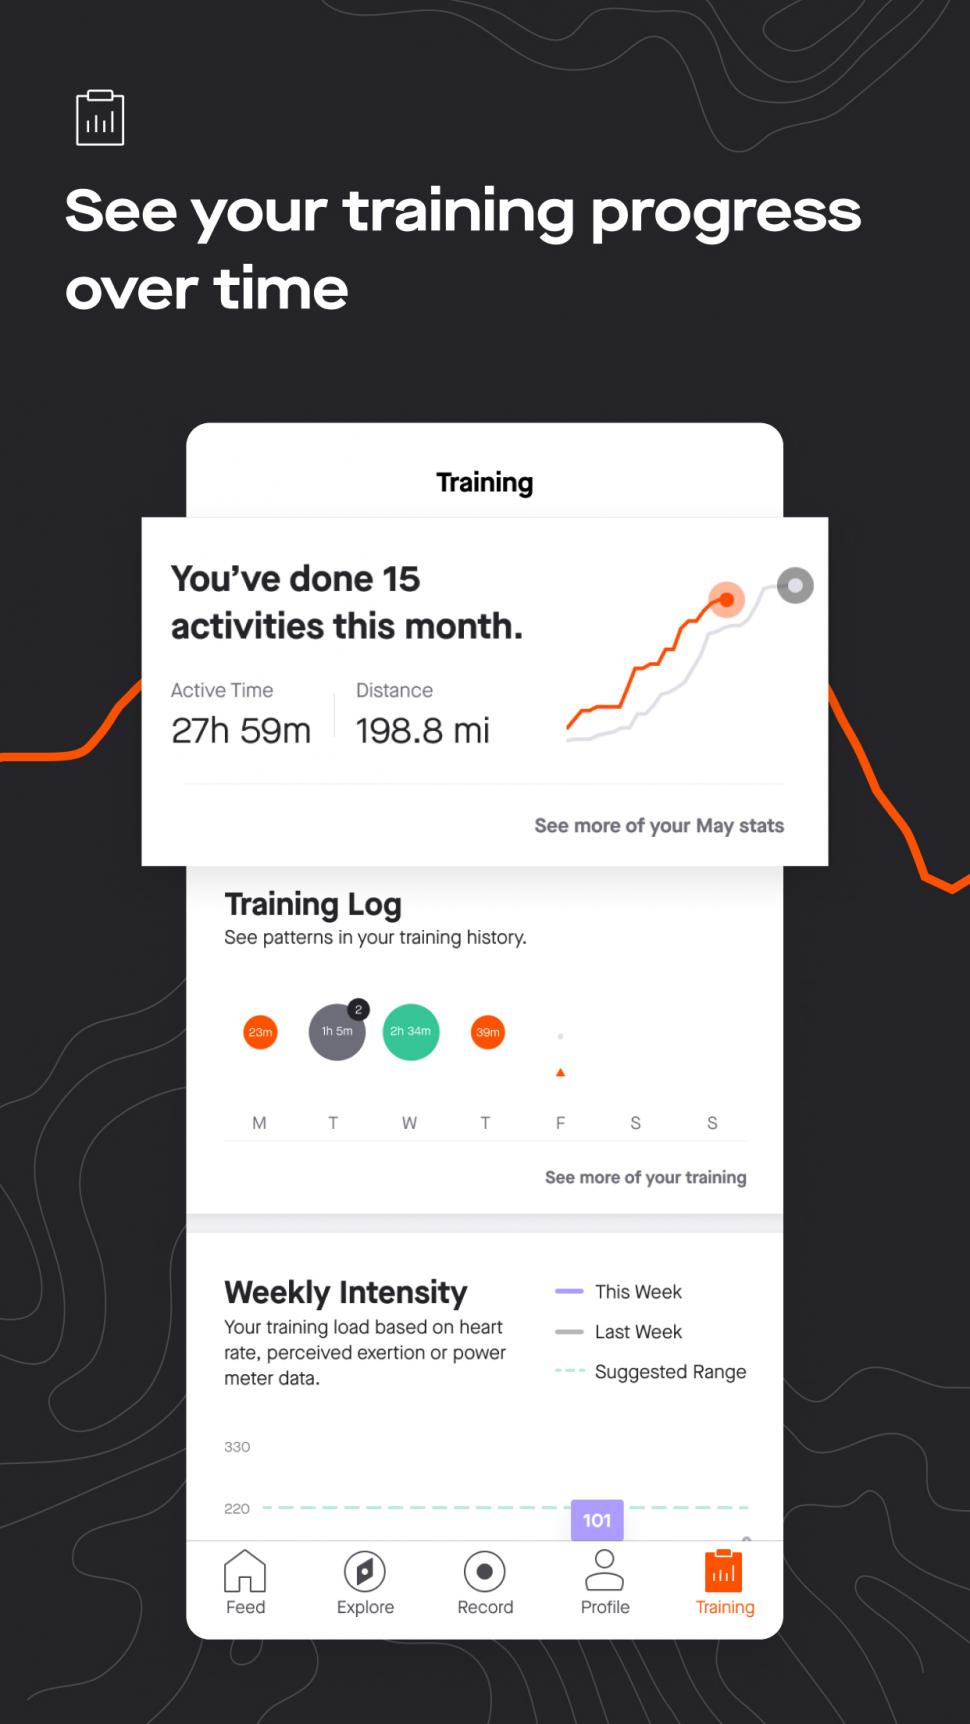
In the Training Log view, Strava uses the size and colour of circles for each activity to visually depict how much training you are doing.
> How to get the most from your limited training time
“It’s a really useful feature for cyclists to view their training load over a period of time as it breaks your load down in a manageable way of looking at it,” Simon says.
Your training can be filtered into different time periods and you can also exclude commutes.
“Activities can be compared based on time or distance or elevation or relative effort. The size of the circle is relative to what you are looking at, for example, time. The bigger the circle, the higher the number,” Simon says.
The colour of the circle also depicts what type of activity you completed, with rides outside being separated from virtual rides.
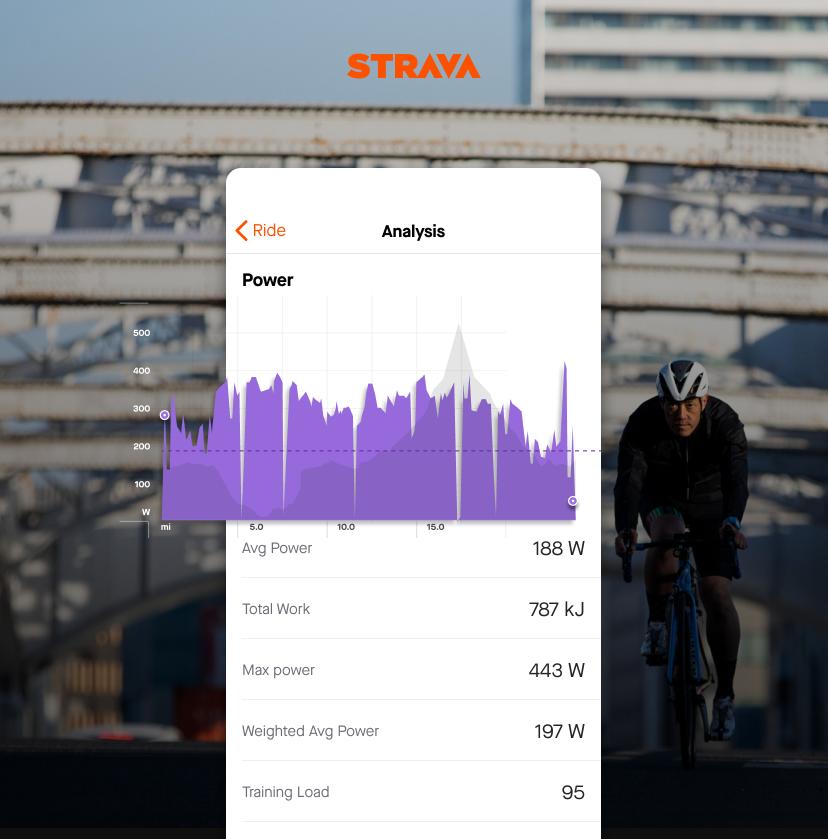
Compare rides using Weighted Average Power
“When you go out on a ride, you have headwinds and hills affecting each ride differently, so it’s really difficult to get a consistent power reading,” Tom admits. “ But Weighted Average Power looks across a ride, at your heart rate and the training zones you were in, to give a much more realistic average power.”
Strava’s Weighted Average Power smooths out the variations and enables you to compare efforts more accurately when you’ve headed out on uneven rides to those with steadier efforts, as it reflects your overall effort.
Focus on strengths and weaknesses with the Power Curve
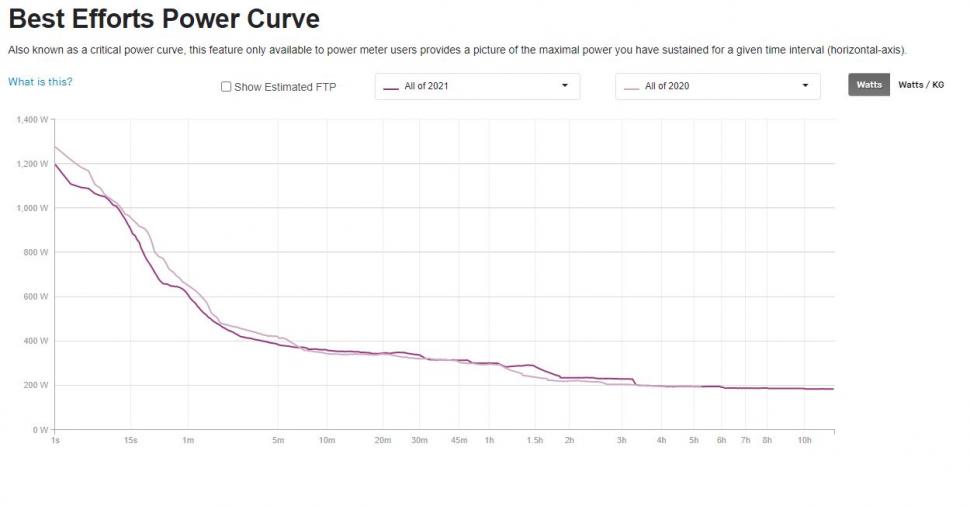
Strava’s Power Curve graph enables you to see the maximum power you have sustained for a given length of time, with readings for as short as one second and up to the duration of your longest bike ride for the selected period. This maximum output can be displayed in either Watts (W) or Watts per Kilo (W/kg).
> What is the most effective time of day to train?
“The Power Curve is super useful as it shows your strengths and weaknesses,” Tom says.
The graph provides a visual overview of your fitness as you can see your power PBs from a selected period of time—for example, the last six weeks, all of 2021, 2020, 2019, etc, or a custom date range. What’s more is that the graph can display two lines, so that’s two different power curves at the same time. This allows you to compare efforts from different periods.
“You can use the Power Curve to see how you are adapting as a rider. In addition to answering the question ‘are you getting fitter in general?', you’ll be able to see if you’re getting fitter at a certain type of effort, whether that’s your one-minute power or 20-minute power, or a length of effort in between,” Tom explains.
Do you have any top Strava tips? Let us know in the comments below.
Anna has been hooked on bikes ever since her youthful beginnings at Hillingdon Cycle Circuit. As an avid road and track racer, she reached the heady heights of a ProCyclingStats profile before leaving for university. Having now completed an MA in Multimedia Journalism, she’s hoping to add some (more successful) results. Although her greatest wish is for the broader acceptance of wearing funky cycling socks over the top of leg warmers.
Latest Comments
- qwerty360 6 min 59 sec ago
My understanding is their is evidence that 2 best ways to measure cycling infra quality are to look at usage by minorities and usage by women. ...
- Secret_squirrel 7 min 50 sec ago
Regular readers will be shocked and stunned to discover that Scotland is even more lenient towards killer drivers than England and Wales when you...
- HoarseMann 8 hours 31 min ago
Probably the best course of action in that scenario is to throw the bike over the hedge before they pull up on the moped and hope nobody else nicks...
- Rendel Harris 10 hours 42 min ago
I know, but you still have to be able to measure to within 1/16 of an inch (1.5mm) and given that it's an either way measurement you have to be...
- Nick T 11 hours 4 min ago
You would notice the overall bike weight increase, but that's not what we're talking about; he specifically states that you will save effort...
- cmedred 14 hours 15 min ago
Lost control of his car doing 40 mph through a 60 mph corner? Sort of begs for some questions as to how Wan obtained a license to drive in the...
- quiff 14 hours 23 min ago
I do understand that policing resources are limited and need to be prioritised, but do we really have to wait until a KSI before they take action?...
- andystow 15 hours 2 min ago
Still no mention of a driver....
- brooksby 17 hours 44 min ago
Electric car smashed up with 'big pole' in protest against Elon Musk (Bristol Post)...

Add new comment
5 comments
Still not happy with Strava after they disabled a lot of features for nonpaying users- Did that save them any money or was it simply a way of trying to encourage people to subscribe? If so, it had the opposite effect.Wouldn't pay for it on principle now.
Nevertheless I'd say there is still some entertainment value to be had in using Strava and it's good if it motivates you in your riding. But in terms of data ,particularly if you are using power on your rides, the free apps such as Garmin connect are more than adequate in tracking your performance.
That's not really the opposite effect, though, is it?* You wouldn't pay for something you weren't paying for anyway. I don't imagine Strava ever thought they'd convert all their non-paying users. But it's quite likely they converted a chunk of them, and as long as the value of that outweighs the value of any non-paying users who abandoned the platform entirely, it will have been a move that paid off for them.
[*The opposite effect would be paying subscribers cancelling because those who didn't pay had lost access to things they still got to use, which seems unlikely.]
There is Chrome extension for Strava called Elevate that has some of these features but doesn't need a Strava premium account. Highly recommended.
https://thomaschampagne.github.io/elevate/#/landing
Veloviewer is also very good. Still need to pay starva premium for segment placings though.
Personally...... as one of the most uncompetitive cyclists out there..... I only use Strava to record my rides from my Bryton 750 or 450 (whichever I use on the day) and share it with my pals.... no "improve" my fitness crap...I ride a Gravel bike on trails and bridleways for that....ask my legs after..... Whatever you do.... Just RIde