- News
- Reviews
- Bikes
- Components
- Bar tape & grips
- Bottom brackets
- Brake & gear cables
- Brake & STI levers
- Brake pads & spares
- Brakes
- Cassettes & freewheels
- Chains
- Chainsets & chainrings
- Derailleurs - front
- Derailleurs - rear
- Forks
- Gear levers & shifters
- Groupsets
- Handlebars & extensions
- Headsets
- Hubs
- Inner tubes
- Pedals
- Quick releases & skewers
- Saddles
- Seatposts
- Stems
- Wheels
- Tyres
- Tubeless valves
- Accessories
- Accessories - misc
- Computer mounts
- Bags
- Bar ends
- Bike bags & cases
- Bottle cages
- Bottles
- Cameras
- Car racks
- Child seats
- Computers
- Glasses
- GPS units
- Helmets
- Lights - front
- Lights - rear
- Lights - sets
- Locks
- Mirrors
- Mudguards
- Racks
- Pumps & CO2 inflators
- Puncture kits
- Reflectives
- Smart watches
- Stands and racks
- Trailers
- Clothing
- Health, fitness and nutrition
- Tools and workshop
- Miscellaneous
- Buyers Guides
- Features
- Forum
- Recommends
- Podcast
news
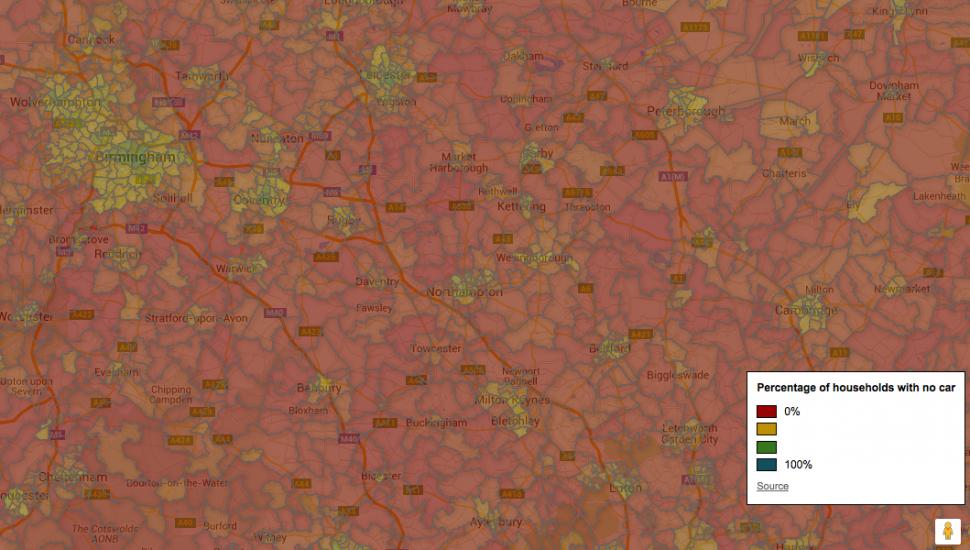
 Car ownership map.png
Map: Find out car ownership levels in YOUR neighbourhood
Many urban areas of England and Wales are populated by a majority of residents who don’t own cars, a new data visualisation has shown.
In London and Newcastle some areas have less than 30 per cent car ownership, leading to fresh calls for more - and better targeted - cycling and walking infrastructure.
Created by Tom Forth of the data consultancy Imactivate, the images map car ownership as declared in the 2011 census.
While rural areas continue to be highly dependent on cars for transport, an active-travel consultant Philip Insall suggested to Bike Biz that the map could be used to ask local politicians whether they know the car-ownership stats in their wards.
Similar maps for Northern Ireland and Scotland can be found at these links.
We reported in 2014 how Peterborough, Colchester and Milton Keynes were identified by the Campaign for Better Transport as the hardest places in England to live if you don't have a car.
At the other end of the scale, London's low rate of car ownership and excellent public transport makes it the easiest place in England to live without a car, followed by Manchester and Liverpool.
In scoring the cities for the report, Car Dependency Scorecard 2014: The top English cities for sustainable transport, the campaign took into account public transport provision, facilities for cycling and walking, and land use planning policies that support sustainable transport.
Peterborough does badly because of weaknesses in its public transport infrastructure and heavy reliance on cars. There are some signs of hope, the campaign says, as many people already cycle regularly, showing there is scope for improvement and a will for active travel.
However, Peterborough might be going in the wrong direction. Last year it planned to rip out cycle racks from a main shopping street, and it recently extended a town centre cycling ban to Sundays despite opposition from consultation responses.
Despite its much-vaunted network of cycle routes, Milton Keynes comes last in many of the metrics. The spread out, low density planning means longer distances for people to travel, and a road system much better suited to car use than cost-effective public transport. Milton Keynes' problems aren't unique; the new towns built in the 50s, 60s and 70s have generally higher levels of car dependency.
However just last month we reported the opposite side of the story - that global bicycle ownership has halved in the past 30 years, according to research.
The study, in the Journal of Transport & Health, analysed data from 1.25 billion households between 1981 and 2012, and is the first to assess global bicycle ownership over time.
China showed the most dramatic changes: in 1992 more than 97% of households owned a bicycle, the figure almost halving to 48.7% in 2007 before rising again to 63.2% in 2009. Northern Europe showed the highest bicycle ownership, while the lowest were in parts of Africa and Central Asia.
Removing India and China from the picture – their high populations skewing the data – researchers noted a steady global decline in household bicycle ownership from an average of 60% in 1989 to just 32% in 2012.
Researchers, based at Johns Hopkins University in the US, weighted data to make it comparable between different countries. They found that geographical proximity and cultural similarities equals similar bicycle ownership levels between countries.
Olufolajimi Oke, lead author of the study, said: "If a country doing well in terms of bicycle ownership, surrounding countries also seem to do well.”
Obviously it means 'springing out of the bunch' on a critical sector. Or maybe it's referring to the time of year.
Car crashes through garden wall for second time in 18 months https://www.wiltshire999s.co.uk/car-crashes-garden-second-time/
Woman taken to hospital after flipping car onto roof in Trowbridge...
Its blindingly obvious from the image that the DKE of the buses include the mirrors which extend to nearly reach the edge of the tarmac pavement on...
It's sad when being very good at your job - any job - isn't enough to earn a decent living. It shouldn't be that way....
Bont double wide wearer here. Even Lake, for me, are too narrow in the toebox and midfoot, but Lake work for a lot of people....
Bigly!
I seem to recall saint Chris being more on recent BBC road cycling coverage rather than less.
I never heard of anyone having their leg sliced off / unexpectedly wiping out using a spoon brake, but discs...
Meanwhile, in the Netherlands... (cycling to hospital, s''Hertogenbosch, Utrecht. Cycling to hospital and cycle parking, Assen)....